
Appearance
How to Use a Knowledge Graph for Notes
Open a graph of your notes and you may see a subject you keep returning to, a cluster of related ideas, or an unexpected connection between two areas of your work. Each can give you a useful place to begin reading again.
To make sense of the picture, though, you need to know what it represents. Does a dot stand for a whole note, a person, or a concept? Does a line mean that you created a link, that two concepts appeared together, or that an algorithm suggested a relationship?
Those details determine what you can learn from the graph.
If you are exploring knowledge graph notes, this guide explains how graph-based note-taking works, how Jotaid, Obsidian, and Capacities approach it, and how to turn a visible connection into something useful for your research or writing.
Published by Jotaid. App features are drawn from official documentation reviewed in September 2026. The examples and suggested workflows are illustrative.
What is a knowledge graph for notes
A knowledge graph for notes represents items and the relationships between them as a network. The items are called nodes, and the relationships appear as edges, usually drawn as lines.
In a note-taking application, the items might be documents, concepts, people, books, or other objects. The graph gives you a way to navigate your material through its connections.
Imagine a collection about learning. It includes notes on feedback, practice, motivation, and expertise. Following a connection could lead you from a classroom example to an observation about how someone learns a musical instrument.
That movement can be valuable when you know the subject you want to explore but do not know which note to search for. A useful graph gives you possible paths through the collection.
The term also needs some care. A graph of linked notes does not necessarily contain formally defined relationships such as “authored by” or “contradicts.” To interpret any graph, first establish what its nodes and lines mean.
How Jotaid and other apps represent your notes
These three applications illustrate different ways of building a personal knowledge graph. The table describes their documented graph views, rather than every workflow users could construct within them.
| App | What the nodes represent | What the connections represent | Graph scope |
|---|---|---|---|
| Obsidian | Notes, with options to include other items such as tags and attachments | Internal links | A vault-wide graph or a local graph around an active note. Documentation |
| Capacities | Objects, such as a person or page | Incoming and outgoing links; property links may carry labels | A local graph around one object. Documentation |
| Jotaid | Concept Nodes | Concepts appearing together in the same notes | The currently selected project. Documentation |
Obsidian helps you follow links between notes
Obsidian’s graph displays the linking structure of a vault. Its local graph narrows the view to the active note and connected notes, with adjustable depth. Filters and groups help you focus the display. Obsidian graph view.
A practical use is to open a note you are developing and inspect its local neighborhood. Follow a link, reread the connected note, and decide whether it adds evidence, context, or a question to your current work.
You can also choose to write dedicated concept notes in Obsidian. The graph reflects how you organize and link those files; a file-based graph can still support concept-based thinking.
Capacities helps you explore an object and its context
Capacities centers its graph on a single object. It shows incoming and outgoing connections, and links made through properties can display their property names. Its documentation distinguishes this local view from a graph of an entire space, which it does not offer. Capacities graph view.
For example, you might open a researcher’s object and explore related meetings, reading notes, or other linked material. The starting point is something specific you want to understand in context.
The labels can also help clarify why two objects are connected. A relationship recorded through a property carries more explicit information than an unlabeled line alone.
Jotaid helps you examine concepts across notes
Jotaid’s graph represents concepts. An edge indicates that two concept Nodes appeared in the same note. The graph and its statistics operate within the selected project, and a Node’s detail panel provides access to notes referencing it. Jotaid knowledge graph.
A Node also has its own text, where you can develop a definition and clarify what you mean by the concept. You can create Nodes manually or review proposals from Smart Node. Creating Nodes.
This makes it useful to approach several sources through a recurring idea. If “feedback” appears across your reading, you can investigate the different contexts in which you have used it and the concepts appearing alongside it.
The graph is only one place these apps differ. If you are choosing between them, How to Choose a Personal Knowledge Management App compares what each one treats as the basic unit of your notes.
Understand what a connection can tell you
Different kinds of connections support different questions. Keeping them distinct makes a graph easier to use responsibly.
| Relationship | What it records or suggests | A useful next question |
|---|---|---|
| An explicit link | Someone connected one item to another | What was the reason for linking them? |
| Concept co-occurrence | Two identified concepts appeared in the same note | What does the note say about their relationship? |
| A labeled relationship | A connection has a recorded meaning, such as an author relationship | Is the label accurate and specific enough? |
| Semantic similarity | A model estimates that pieces of text are related in meaning | Do they make similar claims, or merely discuss the same subject? |
| A predicted connection | A method suggests a relationship worth investigating | What evidence would justify adding or describing it? |
This is a general reading framework; individual apps implement different subsets of these relationships. The gap between the first row and the third is the subject of Why Backlinks Are Not the Same as Relationships.
Two concepts can co-occur because a note compares them, distinguishes them, or argues against connecting them. A similarity score may bring together texts that disagree. A highly connected item may be a broad topic you mention everywhere.
The graph tells you where to look. Reading tells you what the relationship means.
Whether a graph deserves that attention at all is a fair question. When a Beautiful Knowledge Graph Becomes Useful looks at what users of several apps report.
Read patterns in your notes with Jotaid
Once the meaning of the connections is clear, you can begin asking more focused questions about their structure.
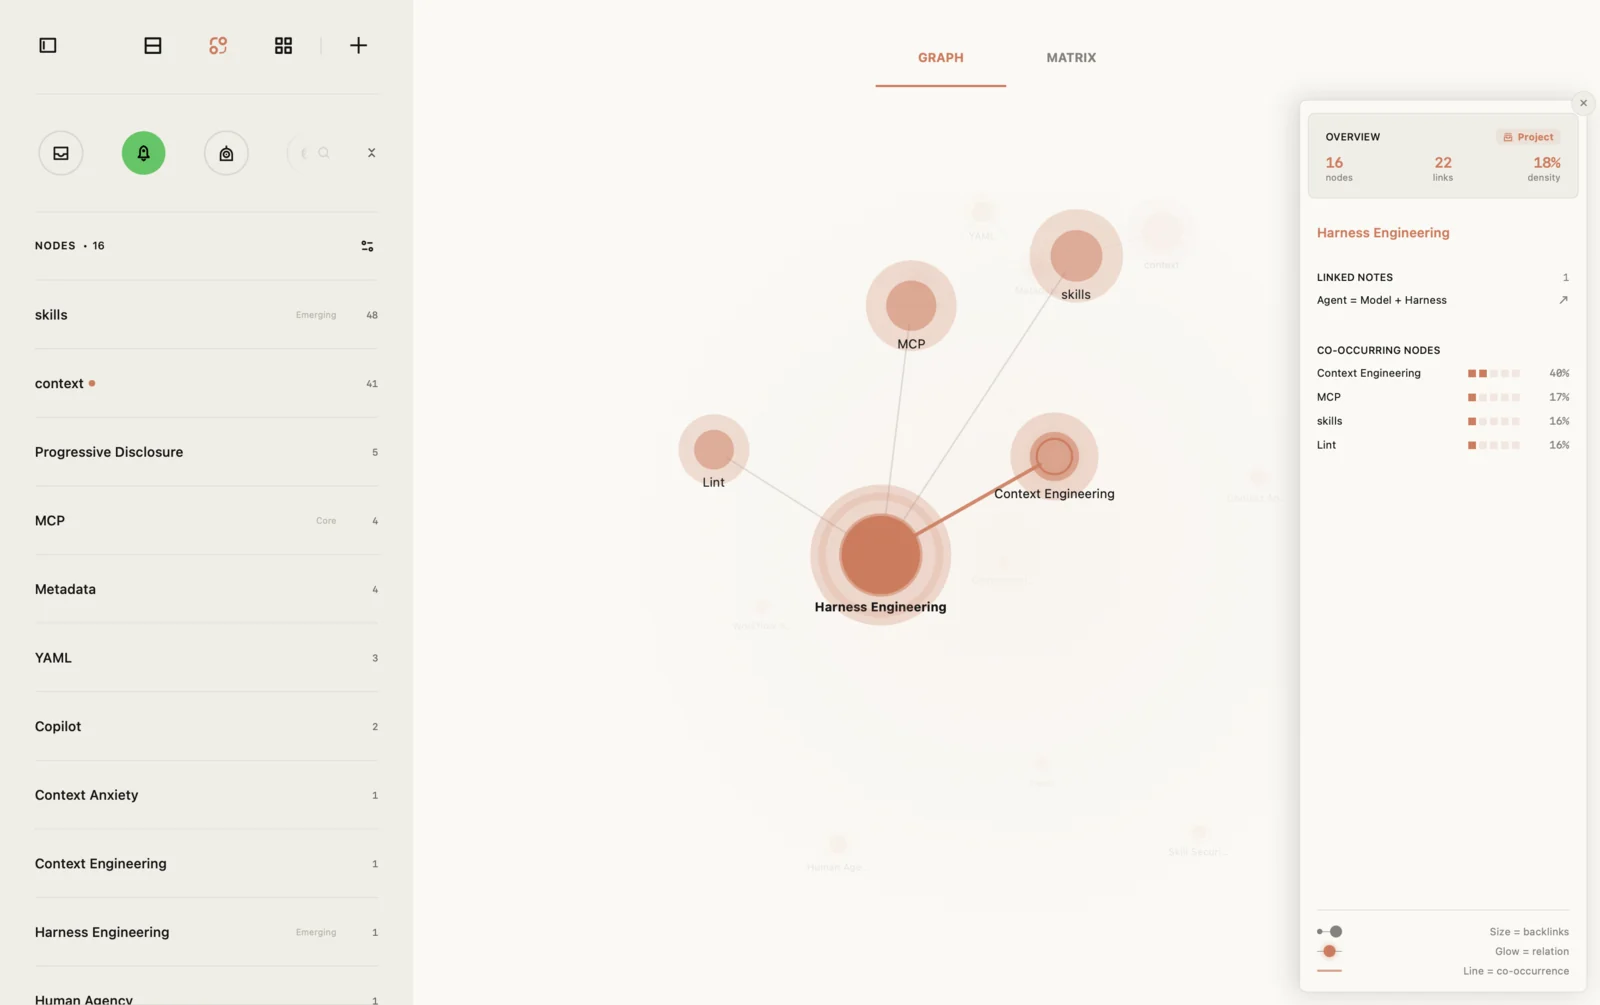
Which concepts repeatedly appear together
Jotaid’s co-occurrence matrix offers another view of the relationships shown in its graph. It represents connection strength using the proportion of overlap between concepts’ appearances. The matrix can reveal clusters and connections between clusters. Co-occurrence and matrix.
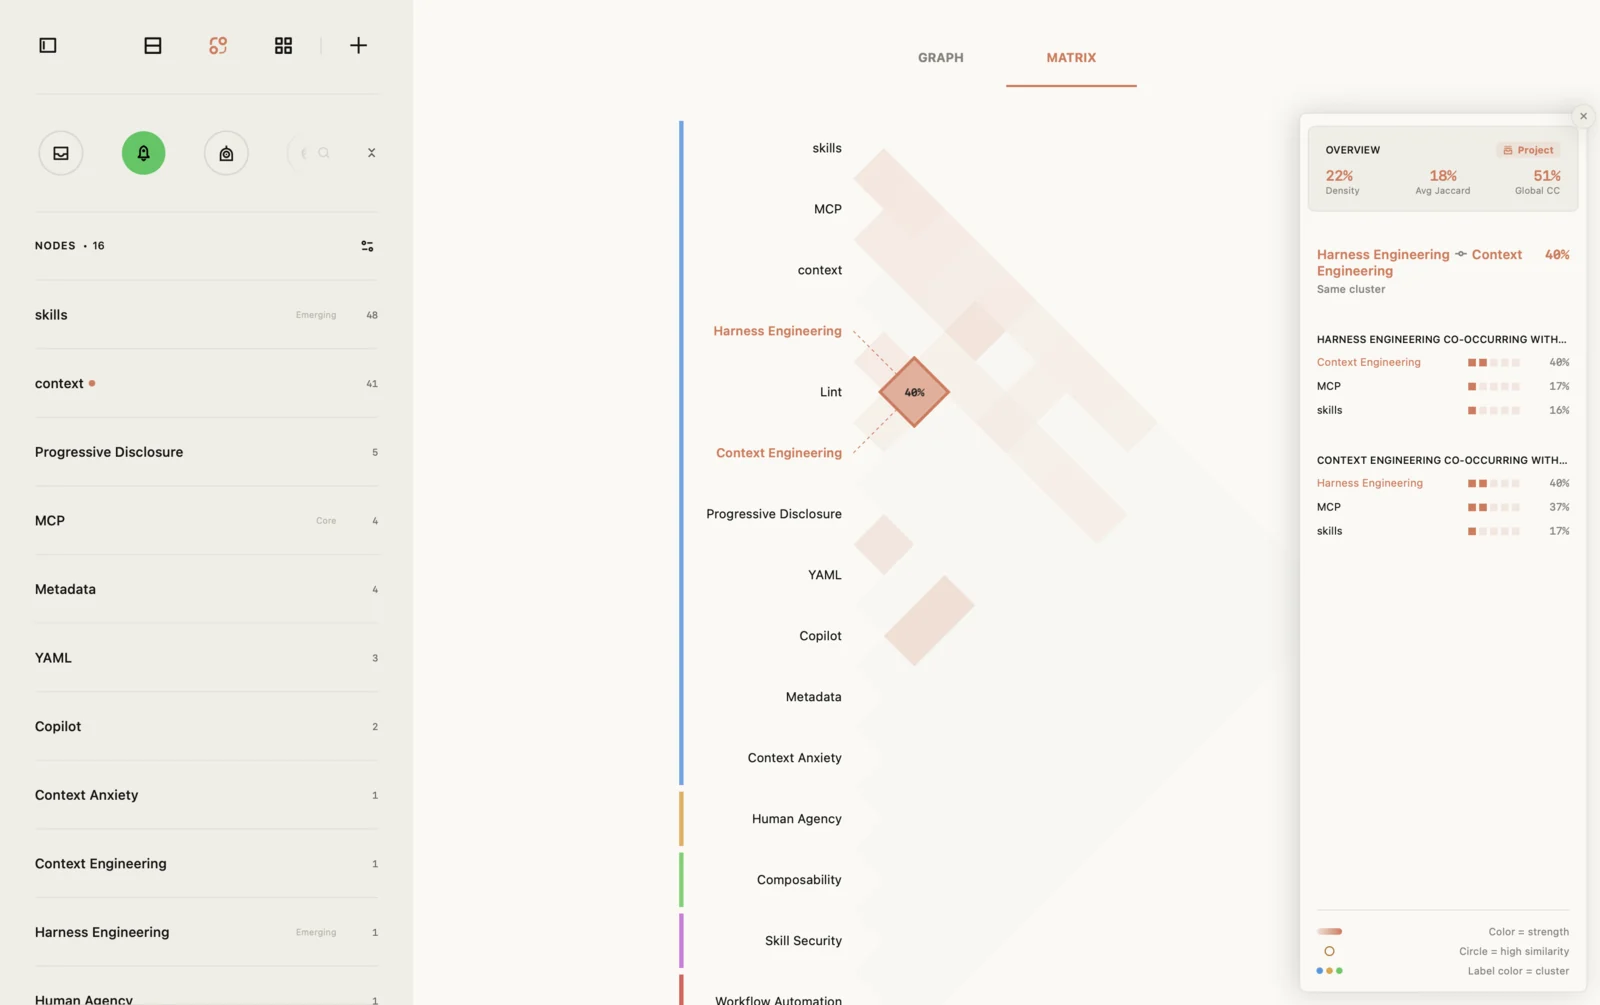
Suppose you frequently connect “feedback” and “motivation” in notes about learning. Open the supporting material and ask what connects them. Are the notes concerned with the timing of feedback, its tone, or whether a learner can act on it?
A strong connection helps you select a promising question. It does not establish that feedback has a particular effect on motivation.
Which concepts connect different areas
Jotaid uses Core, Bridge, and Emerging badges to help describe a concept’s position or recent activity. Core indicates a well-connected concept within a dense neighborhood. Bridge indicates a concept connecting otherwise less-connected areas. Emerging indicates recent activity. Node types.
Imagine that “feedback” appears in notes about both teaching and product design. That could be a useful place to compare your material. Does the word describe the same process in both settings? Could an example from one field help you ask a better question in the other?
These badges are navigation aids. A central concept is not automatically your most valuable idea, and an isolated note may contain something important you have only just encountered.
Which potential connections deserve a closer look
Jotaid also offers link predictions based on graph structure. These suggest concept pairs that have not co-occurred and show shared neighboring concepts behind the suggestion. Link predictions.
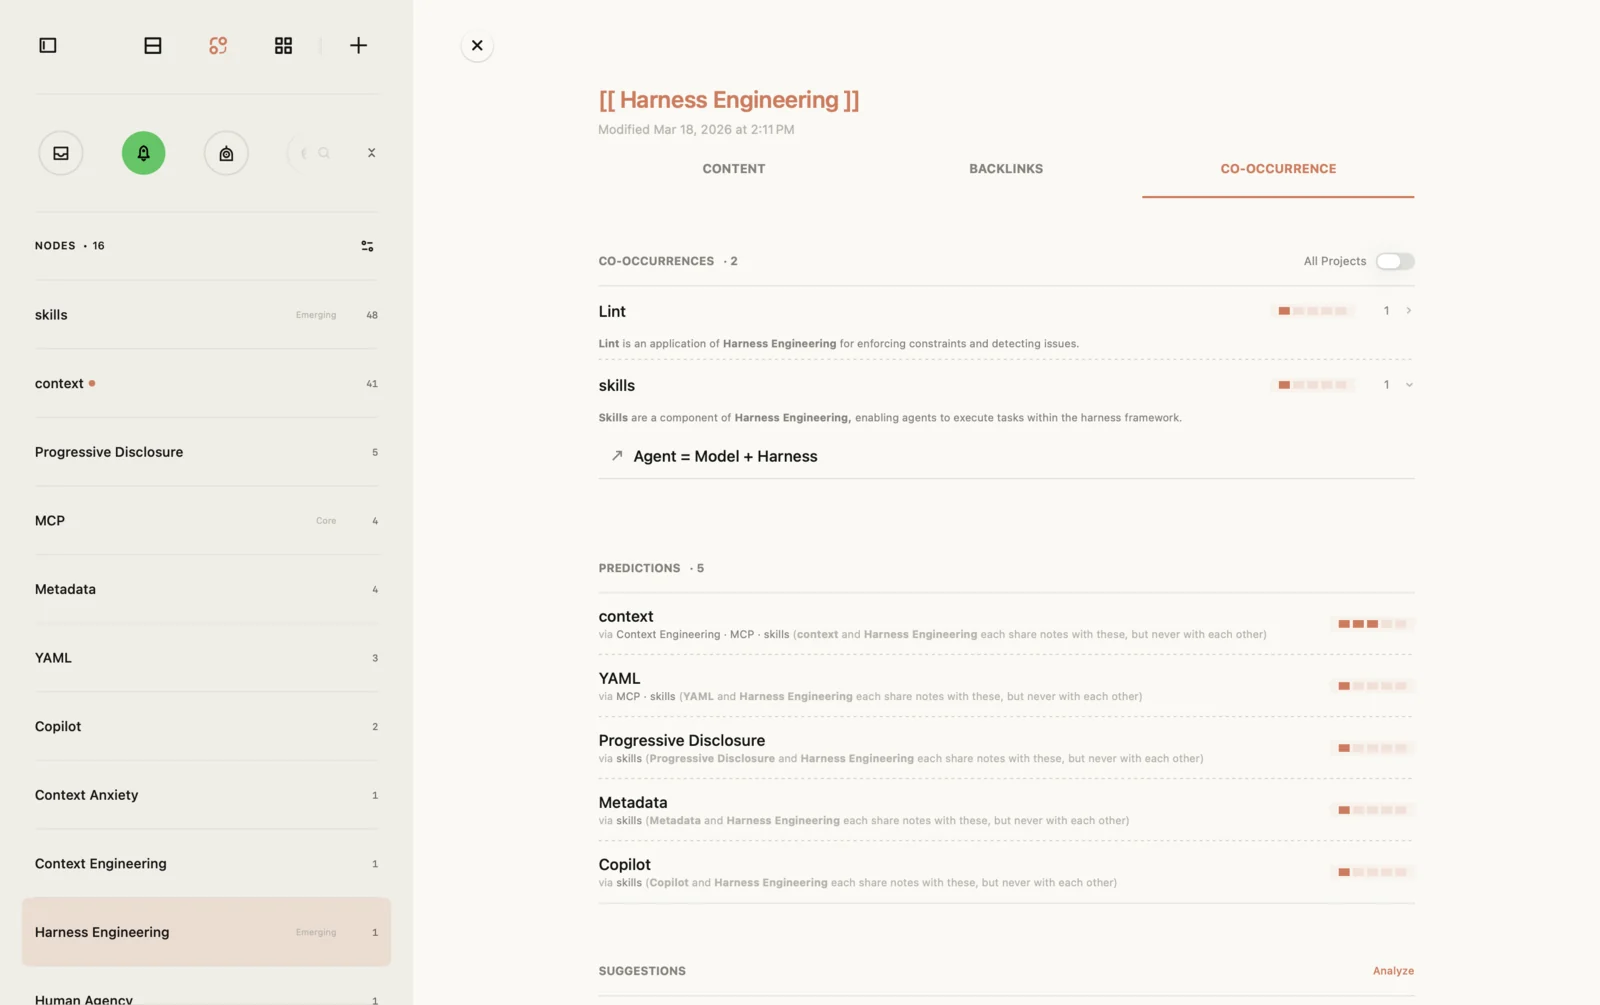
Use a prediction as an invitation to compare. You may discover a useful relationship, decide the concepts belong apart, or realize that a broad term is obscuring an important distinction.
Each outcome can improve the clarity of your notes. There is no need to accept a connection simply to make the network denser.
The graph, the matrix, the badges and link predictions are part of Jotaid’s free tier, in the Inbox. They analyse the links you wrote yourself and involve no AI. Free vs Pro.
A practical workflow for knowledge graph notes
Start with a question you are already trying to answer. For example: “What makes feedback useful enough for someone to act on it?”
Capture observations with their context. Keep the source, the relevant passage or example, and your own interpretation distinguishable. A statement about a specific classroom should remain recognizable as that kind of evidence when you revisit it.
Name a few recurring concepts. In Jotaid, you might create Nodes for feedback, timing, and actionable guidance. Give each a short definition. In another app, you could use concept notes or objects for a similar purpose.
Inspect one relationship. Follow a connection that bears on your question and read the notes behind it. Ask whether the sources support one another, disagree, or describe different situations.
Write down the interpretation. A useful sentence might be: “In these examples, feedback seems easier to use when the recipient can identify a specific next action.” Keep the scope visible and record exceptions.
Gather the material for further work. In Jotaid, a Theme lets you group related notes and write an overview in the Theme’s own text. Its canvas gives you a spatial way to arrange the material. Working with Themes.
You now have a starting point for a paragraph, a research question, or a practical decision. The graph helped you find and examine the material; your written interpretation preserves what you learned from it.
Use AI to help explain a relationship
Jotaid’s AI interpretation features can help explain a relationship in the matrix or propose additional links. They require Pro and your own API key. These explanations are interpretations that should be checked against your notes. AI interpretation and suggestions.
When reviewing an explanation, ask whether it distinguishes the sources, acknowledges counterexamples, and identifies what is still uncertain. A useful response gives you something specific to inspect or revise.
The structure can also support work outside the graph interface. On macOS, Jotaid can serve your notes to AI agents running on the same Mac over MCP, so a compatible agent can consult concept relationships and the notes behind them. The connection is read-only, off by default, limited to the projects you choose, and requires Pro. Release notes.
Keep your graph useful as the collection grows
The quality of a personal knowledge graph depends partly on the choices you make while writing. A few habits can keep it interpretable:
- Give recurring concepts consistent names, while preserving distinctions that matter.
- Explain important relationships in prose so you can recover your reasoning later.
- Inspect the underlying notes before acting on a pattern or suggestion.
- Treat broad, frequently used terms carefully; they may connect material without explaining much.
- Revisit unanswered questions and disagreements as you add new sources.
A graph reflects what you have captured and connected. An empty area may mean you have not explored a subject, or that your notes do not yet represent it clearly. The graph alone cannot tell you which.
Choose the graph that helps you ask better questions
When comparing knowledge graph note-taking apps, try the same small collection in each. Follow a connection, recover its context, and see whether you can write a clearer explanation afterward.
Obsidian, Capacities, and Jotaid offer different starting points for that work: linked notes, the neighborhood around an object, and relationships between concepts. The approach that fits depends on the questions you want to ask of your collection.
Jotaid brings notes, concepts, and Themes into one workflow so that an observation can become a connection, and a connection can lead to a developed line of thought. That is the role of a personal knowledge engine: helping what you have already recorded contribute to what you understand next.
Start with a question hidden somewhere in your notes.
Cover photo from Unsplash.